Gamma Exposure (GEX)
Using the discovery endpoints discussed in the Workflow section, let's investigate some data from the Gamma Exposure set. Here we will look at the last measurement for the nearest expiration.
# Gamma exposure.
metric = "gex"
# S&P 500 index.
ticker = "SPXW"
# Discover available expiries.
expiries = list_expiries(metric, ticker)
# Select the nearest non-expired expiry.
expiry = select_nearest_future_expiry(expiries)
# Fetch the latest GEX measurement for that expiry.
latest = get_latest_measurement(metric, ticker, expiry)
# Visual check of data.
print(latest)
# Extract data from API response.
payload = latest["payload"]["data"]
# Get the strikes and gamma exposure data.
strikes = np.asarray(payload["underlying"], dtype=float)
call_gamma = np.asarray(payload["call_gamma"], dtype=float)
put_gamma = np.asarray(payload["put_gamma"], dtype=float)
# Convert timestamps to readable UTC for the title.
meas_dt = datetime.fromtimestamp(
latest["measurement_time"], tz=timezone.utc
).strftime("%Y-%m-%d %H:%M UTC")
exp_dt = datetime.fromtimestamp(
latest["expiry"], tz=timezone.utc
).strftime("%Y-%m-%d %H:%M UTC")
# Plot.
plt.figure(figsize=(10, 6))
# Set the width of the bars for plotting.
bar_width = (strikes[1] - strikes[0]) * 0.9
# Plot call gamma exposure.
plt.bar(
strikes,
call_gamma,
width=bar_width,
label="Call Gamma Exposure",
)
# Plot put gamma exposure stacked on top.
plt.bar(
strikes,
put_gamma,
width=bar_width,
bottom=call_gamma,
label="Put Gamma Exposure",
)
plt.xlabel("Strike")
plt.ylabel("Gamma Exposure (Γ × OI × Multiplier)")
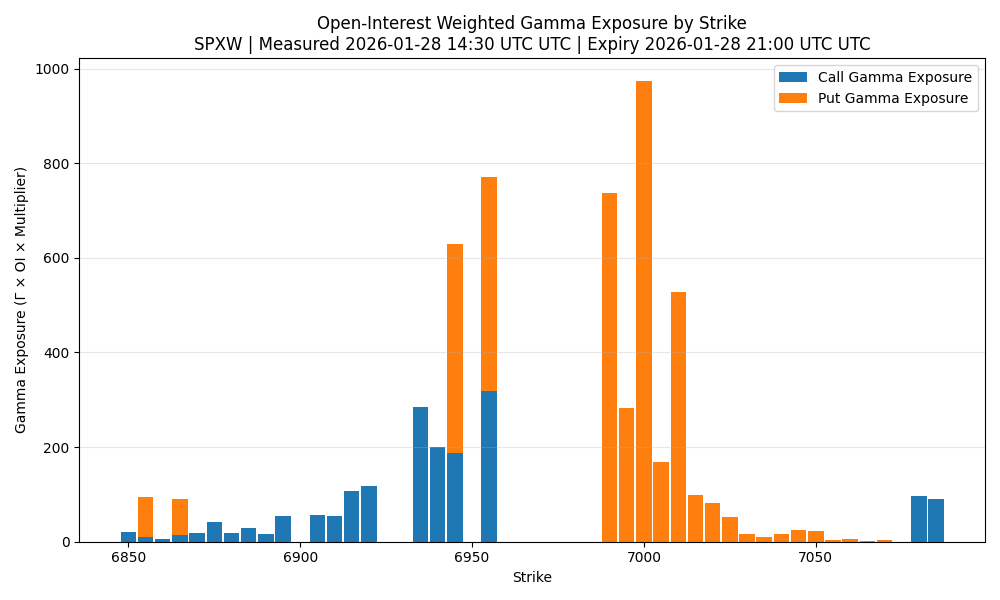
plt.title(
f"Open-Interest Weighted Gamma Exposure by Strike\n"
f"{latest['ticker']} | Measured {meas_dt} UTC | Expiry {exp_dt} UTC"
)
plt.legend()
plt.grid(axis="y", alpha=0.3)
plt.tight_layout()
plt.show()
A plot of the data is shown below.